Characterization
(1) Constant flow bubble cases
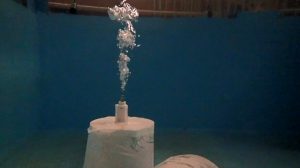 Photo for constant flow bubbles
 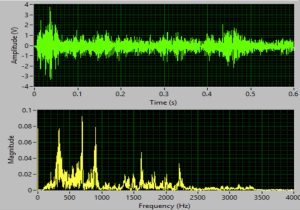 The signal for constant flow bubbles in time and frequency domains
  The total energy vs flow rate (nitrogen)
  The total energy vs jet velocity (nitrogen)
 The total energy vs flow rate (methane)
 The total energy vs jet velocity (methane)
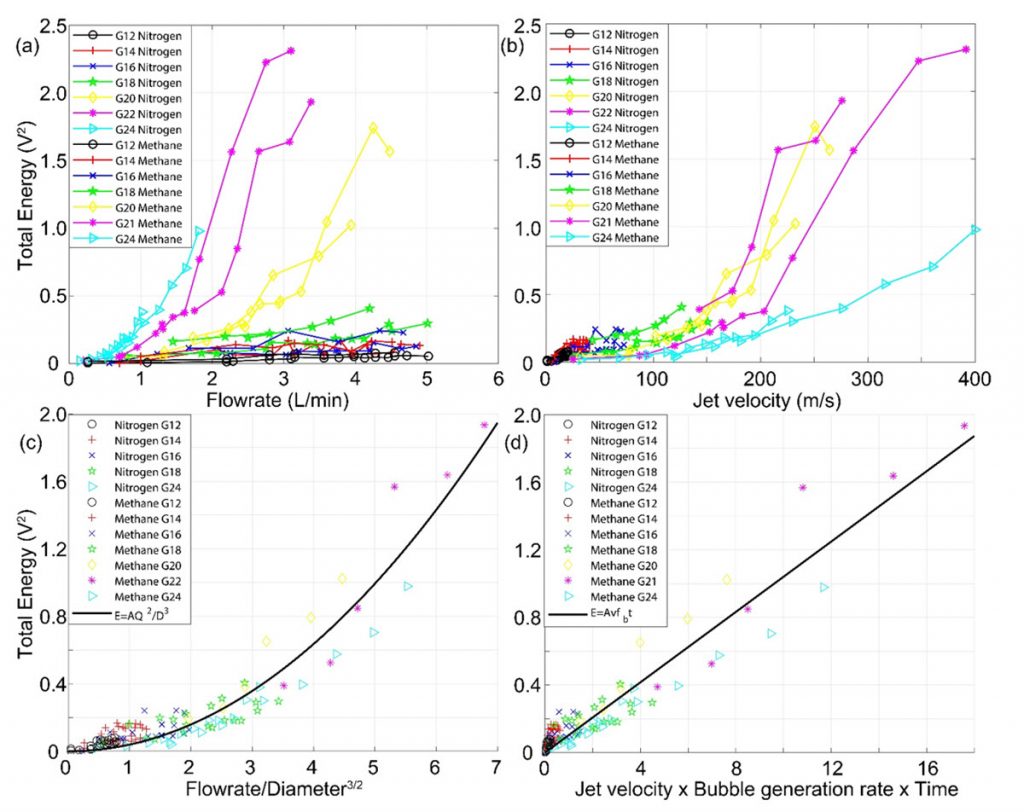 (a) Total energy vs flow rate, (b) total energy vs jet velocity, (c) total energy vs flowrate2/diameter3, and (d) total energy vs jet velocity× bubble generation rate×time for both nitrogen and methane.
(2) A few bubble cases
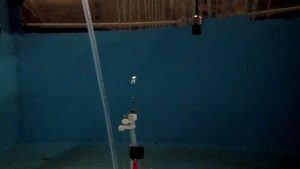 Photo for a few bubbles
 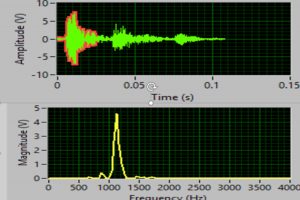 The signal for a few bubbles in time and frequency domains
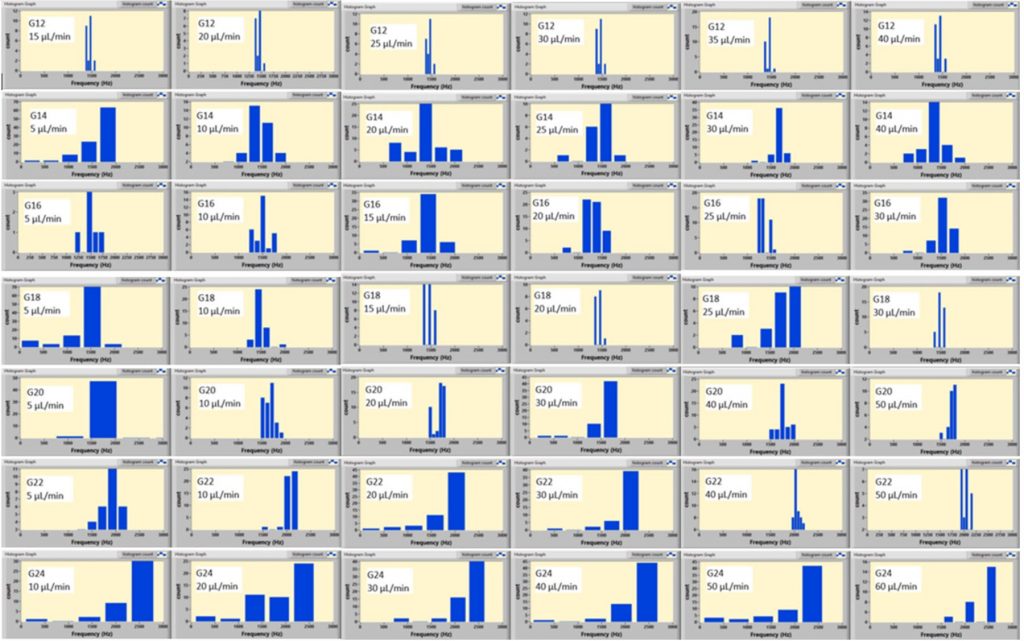
 The histograms of resonant frequency for different needle diameters and flow rates (nitrogen)
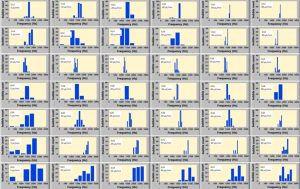
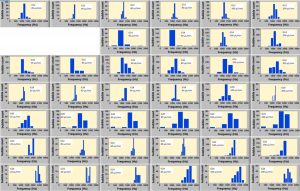 The histograms of resonant frequency for different needle diameters and flow rates (methane)
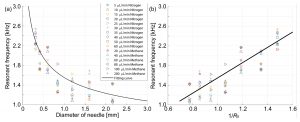 (a) The resonant frequency vs the diameter of the needles, where µL/min in the legend denotes the flow rate and the solid line is the regression line, and (b) The resonant frequency vs 1/R0, where R0 is the effective radius of a spherical bubble.
(3) Bubble size distributions
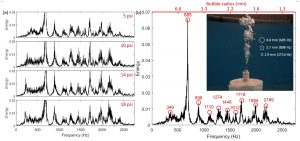
(a) Sound frequency spectrum for several pressure for nitrogen gas with the needle number being G14. (b) Frequency spectrum under pressure of 10 psi with the peak frequencies and corresponding bubble distribution marked. Inset: corresponding photo with some referenced bubble size marked.
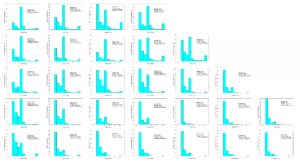 Bubble number percentage histogram for Nitrogen gas with all needles and flowrates.
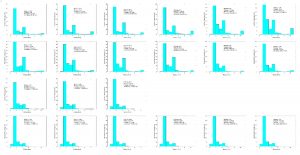 Bubble number percentage histogram for methane gas with all needles and flowrates.